
Let's talk on "how to troubleshoot or analyze performance issues in Linux". There are many a times that we find a server performing slow (specifically a Linux system ) compared to previous days or sluggish or in a worst case system responds slow i.e running a simple command such as “ls” would take more time to respond. So, at that juncture a system admin or person in charge of system would be in a dilemma on what is causing such slowness, is that the processor (CPU overloaded), or memory (high memory usage) or network (slower network channels) or disk (poor performance of disk drives) or a bug with an application or kernel. No amount of tuning would help if a hardware component is broken. Identifying bottlenecks at this point of time would need a proper analysis of system sub-components. Therefore, I came up with this page which documents simple steps/instructions/navigation which can be used to identify culprit for system slowness and later more advanced steps/commands could be used to dig further (only a few most followed commands and steps are documented here i.e native).
<<---- General/common guidelines----->>
<-> At broader level, we need to first identify resources which are culprit for system slow/performance issues. Well, it may be a bug in the kernel or in an application or a mal-functioning hardware sub-system. Hence, in analyzing a performance issues we need to thoroughly study system and identify the hot spots. Once we get to know which component is causing the issue then further analysis would be easy.
<-> Since a customer doesn't provide/not aware of the exact cause, it is better to start identifying causes at system level. Also, understanding recent changes if any could facilitate in analyzing such a cause.
<-> When an exact cause is not known, one could start by checking "load average" to see if CPU is the culprit or something else. If load average seems to be fine then issue could be with memory or network etc,. At times, just checking load average may not be enough (when performance was bad previously), hence, need to filter SAR(System Activity Report) dump data for load and check based on when performance glitch was reported.
<-> Check the recent system logs (/var/log/messages) to notice if any failed/error/warning messages.
<-> Run "vmstat 1 50" (dstat command can also be used which is an advanced one) which would print continuously system statistics of 50 samples (process status, memory details, Swapped in/out, IO in/out, CPU usage details, interrupts details etc.,) and check if there is any un-usual trend (remember to ignore the first line of data since it is an average from last reboot).
<-> If there is slowness/glitch when accessing network shares or any remote transfer/retrieval of files/data would necessarily point to network segment which needs further analysis.
<-> Once the main component is identified which is causing the issue then need to check if there is any tuning required for that component or component upgrade is necessary.
<-> If there are no abnormalities reported from any of the hardware components then there could be a bug which is either application or operating system related. Sometimes it could be due to improper tuning of an application which results in performance slog.
<-> If system is not meeting the minimum requirements of an application then we can't expect a good & steady performance, so it is always recommended to make sure system hardware sub-components are in agreement with application prerequisites.
For each hardware subsystem following common procedure/guidelines could be followed
<<>> for CPU(processor) <<>>
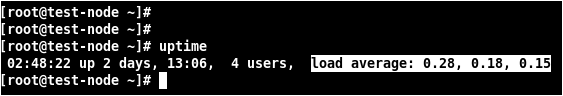
<-> The first command that can give a glimpse of average CPU usage for last 1,5 and 15 minutes is "uptime". Run this command and check the load average. Those numbers would actually show the average number of processes waiting for CPU resource in the last 1, 5, and 15 minutes respectively. So, the CPU is not busy in this case (as shown in below snap) and this is run on a virtual system with one processor. Normally, we calculate system load based on number of processors (logical) available. Simply speaking this means that a single processor system with load average of 1 is as busy as 4 CPU based system with load average of 4. This is how it works: Divide the load average value by number of logical CPUs. So, any value below 1 would indicate normal working & minimum wait time, however, any value above 1 would indicate resource saturation and some amount of wait time.
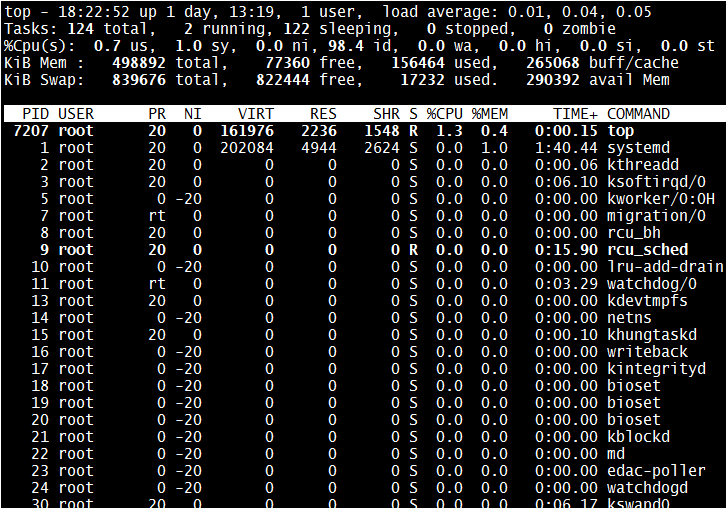
<-> The next most convenient and user friendly command to be used is "top". Use top command to observe processor statistics as by default it would show processes list based on CPU utilization (high-low). By default, when "top" command is run without options it would open up in monitor mode window which dynamically populates data.
<-> If any process is consuming more CPU resource (sometimes 100% CPU Usage) then we would need to reduce the priority of such a process by doing a re-nice. This is demonstrated further in the document. Also note that high CPU usage doesn't necessarily mean that CPU is busy or occupied, however, it could be because it is waiting for input from other subsystems such as storage ( IO wait).
<-> To further analyse load on CPU we could use "vmstat" (Virtual Memory Statistics) (belongs to sysstat package, and other popular commands such as iostat, mpstat, pidstat are also part of this package) to dynamically view CPU statistics which could aid in understanding about time spent in running kernel-space code, user-space code, wait time (percentage of time spent blocked while waiting for IO to complete), idle time etc. If there is a spike in "%usr" value then this indicates that system has spent time in running a user space process, otherwise, if there is high usage percentage for "%sys" then it says that system was busy in running a kernel thread.
-> Let's generate some load on CPU and see how could we analyze and troubleshoot it.
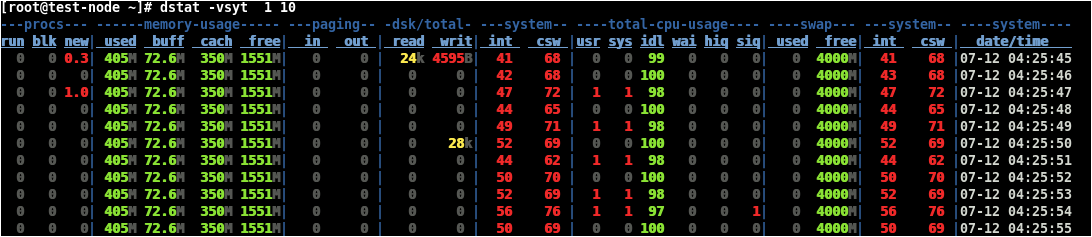
So, let's run the "vmstat" command before generating load which we could use for comparison later. Now, we'd run "vmstat" to print stats with 1 second of delay and 10 samples showing in kilo bytes with timestamps as shown below:

-> In the above snap the processor is almost idle. So, lets spin up "sha1sum" and "md5sum" commands to create load on processor and see how it behaves now. We could simply run the command : " sha1sum /dev/zero & " and " md5sum /dev/zero & " without quotes to generate load (spin up more sha1sum and md5sum threads to increase the load as required). These two threads are started to run in background. Now, you could see that the processor is busy in executing user-space task as shown in the below snap:-

-> Also, you may notice that the "wa" column is zero (otherwise, "%wa" in top), that means CPU is not waiting for IO or for any other sub-systems. The first row of data generated is always the average since most recent reboot hence that can be safely ignored.
-> At this time we come to know that the processor is busy and there are 2 tasks which are consuming high CPU cycles, so check what are those processes now using "top" command:-

-> As shown in the "top" command, we could see that "sha1sum" & "md5sum" process threads are eating up CPU space and they are the culprits for high CPU usage, as rightly shown. If it is known that these processes should not consume so much CPU and because of this other processes are starving, then we could reduce the priority of such process.
-> Now, those two processes are running with default nice value of 0. So, to reduce the priority we'd need to re-nice it with plus digit as nice value ranges from 19 to -20 (lowest to highest). Let's say that we'd need to reduce the priority of "md5sum" process then we'd re-nice it using the command "renice -n <Priority> <PID>" (renice -n 10 9644) and then run "top" command to check on status ( otherwise, using "vmstat" command) :

-> As noticed now, the "md5sum" thread is consuming less CPU so that other processes would get it. The other ways of reducing process CPU usage limit is by using "cpulimit" command or using "cgroups". When the "cpulimit" command is used it would delay process execution by a short interval hence, a process would consume less CPU cycles.
<-> The "mpstat" command could be used to understand each processor statistics in a multiprocessor system. If processor architecture is NUMA based then "numactl" and related commands could be used to understand numa hits and misses.
Example: Using "mpstat" to print CPU stats with 1 second interval of 3 samples :

<-> The "dstat" is another versatile tool which can be used to fetch system statistics and it got so many options which can be used such as "--top-cpu (shows expensive process), --top-mem (most memory consumed process), --top-io (most expensive IO process)" etc. This command is provided by "dstat" package which is available in standard server repo channel or from ISO image which needs to be installed. To get a list of arguments that can be passed to dstat command run "dstat -h".
Example: To pull out system statistics dynamically with delay of 1 second and 10 sample outputs:
<-> Stopping unnecessary processes would also yield in improving system performance.
<-> If there is a need to check the CPU statistics for earlier days then we could use 'sar' data (/var/log/sa) and observe the stats:
# LANG=C /usr/bin/sar -P ALL -f /var/log/sa/sa<XX>
OR
# LANG=C /usr/bin/sar -u -f /var/log/sa/sa<XX>
Example: To understand processor statistics dynamically for today between 4:00 - 5:00 (with 10 minute interval):-

<-> To find out top 5 CPU resource hogs we could use the below command:
# ps -eo pcpu,pmem,pid,ppid,user,stat,args | sort -k 1 -r | head -6|sed 's/$/\n/'
<<>> for RAM (memory) <<>>
[-] Start analyzing high memory usage using "free" command, otherwise, using "top" or "vmstat" etc., commands. Use "free" command and check on memory available which is a combination of free+buffers+cached pages (in RHEL7 and above there is "MemAvailable" field from /proc/meminfo which tells about the same).
Example: To understand memory usage dynamically, we could run "dstat command with 2 seconds delay and to print 5 samples as shown below:

[-] Alternatively, run either "free" command or "cat /proc/meminfo" as shown (this output is taken on RHEL6.x virtual system):

[-] High memory usage or consumption in a Linux system is common and that is how the kernel is designed to work. An un-used memory in Linux is a wasted memory, hence, kernel would always try to utilize the RAM as much as possible and how this happens is through caching. Every bit of data which gets read/written from disk would also gets stored in RAM for processing which is a usual process. However, this data would not be flushed out of memory (RAM) immediately even though it is not being used. Kernel would keep such data in memory (cache) and that's how RAM gets filled up fast. Such cached memory pages would get cleared by kernel as and when required.
If a system is showing high memory usage (almost no 'available' memory = free + buffers + cached) and also swap space is being consumed (keeps growing) then it certainly indicates that system is under memory pressure. However, no 'free' memory left out and 'used' memory is almost close to 'total' memory should not be of any concerns. Memory management is one of the nice features of Linux kernel which intelligently manages it out to get the best performance.
If a system is showing high memory usage (almost no 'available' memory = free + buffers + cached) and also swap space is being consumed (keeps growing) then it certainly indicates that system is under memory pressure. However, no 'free' memory left out and 'used' memory is almost close to 'total' memory should not be of any concerns. Memory management is one of the nice features of Linux kernel which intelligently manages it out to get the best performance.
Why swap is getting used though there is enough free memory?
Linux handles swap space efficiently. While swap is nothing more than a guarantee in case of over-allocation of main memory in other operating systems, Linux kernel utilizes swap space far more efficiently. Virtual memory is composed of both physical memory and the disk subsystem or the swap partition. If the virtual memory manager in Linux realizes that a memory page has been allocated but not used for a significant amount of time, it moves this memory page to swap space. Often you will see daemons such as "getty" that will be launched when the system starts up but will hardly ever be used. It appears that it would be more efficient to free the expensive main memory of such a page and move the memory page to swap. This is exactly how Linux kernel handles swap, so there is no need to be alarmed if you find the swap partition filled to 50%. The fact that swap space is being used does not mean a memory bottleneck but rather proves how efficiently Linux handles system resources. Also, a swapped out page stays in swap space until there is a need for it, that is when it gets moved in (swap-in).
Why is there a high amount of cache memory being consumed? What is this "cached/cache" in free command output?
Simply it shows the amount of RAM space occupied by "Page Cache". Cache pages are nothing but the data/files which gets copied over to RAM when kernel performs read/write operation on a disk. The reason for keeping these page cache is for I/O performance. So, kernel maintains these files on RAM and frees them up whenever not required or whenever a new memory space is requested by a new process/command provided no free space available in RAM. For a simple read operations it would be marked as "clean" pages, however, writes would mark them "dirty" and becomes clean after updating on disk. These "cached" pages would remain in memory even not used and would not move out even when not required. So, as a system usage goes these cached pages size would also grow. This is usually not a concern to be worried, however, sometimes yes when "cache" is consuming most of the memory and system starts to swap pages.
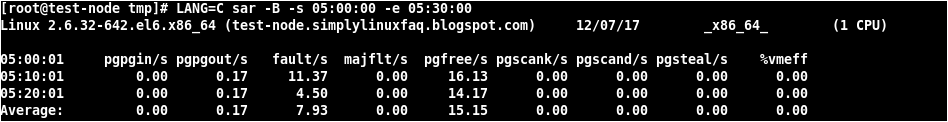
[-] Check out page faults (major faults) using "sar -B" command, if there are major faults then it would certainly delay since page needs to be moved from disk to memory.
Example: To check the page faults happened between certain time stamp using sar command:-
Even the "dstat --vm" command can be run to view major/minor page faults dynamically.
[-] Use "ps" to view major and minor page faults for a process as shown below:-
# ps -o pid,comm,minflt,majflt <ProcessID>
[-] To find out processes wise memory consumption, use "pidstat" command which is part of the sysstat package. So, to find out memory usage for active process we could use "pidstat -l -r|sort -k8nr", otherwise use "pidstat -p ALL -l -r|sort -k8nr" to find out for every process (including inactive) as shown below (column marked shows memory usage which is %MEM column):-

[-] Otherwise, one could use 'ps' command to find out top 10 memory consuming process/threads as shown below:
# ps -eo pcpu,pmem,pid,ppid,user,stat,args | sort -k 2 -r | head

[-] If there is a need to check the memory statistics for earlier days then we could use sar data (/var/log/sa) and observe the stats:
# LANG=C /usr/bin/sar -r -f /var/log/sa/sa<XX>
EXAMPLE: LANG=C /usr/bin/sar -r -f /var/log/sa/sa22
[-] To check swap statistics of earlier days, please use sar command as shown below:-
# LANG=C /usr/bin/sar -S -f /var/log/sa/sa<XX>
[-] Check the private memory space of a process using "pmap" command.
[-] Try to implement hugetlb, increase/decrease page size, stop unnecessary services/daemons, add more memory if there is a physical memory crunch.
[-] If there is a high pressure of cache memory then one could start flushing out dirty data sooner than defaults by tuning "dirty_background_ratio" to lower values. Also, in some cases where kernel starts to swap-out pages instead of reclaiming from cache then one could lower the "vm.swappiness" to decrease rate at which pages are swapped out. A low swappiness value is recommended for database workloads. For example, for Oracle databases, Red Hat recommends a swappiness value of 10. The default value is 60.
dirty_ratio: Defines a percentage value. Write-out of dirty data begins (via pdflush) when dirty data comprises this percentage of total system memory. The default value is 20. Red Hat recommends a slightly lower value of 15 for database workloads.
dirty_background_ratio: Defines a percentage value. Write-out of dirty data begins in the background (via pdflush) when dirty data comprises this percentage of total memory. The default value is 10. For database workloads, Red Hat recommends a lower value of 3.
[-] If there is a memory leak from an application then advanced commands/tools such as "valgrind" could be used to detect such issues (need to install valgrind package).
<<>> for Hard Disk Drives (IO) <<>>
-- Slow disks would cause memory buffers being filled up which would delay all disk operations. CPU idle time would increase since CPU would be waiting for IO from disks.
-- The "vmstat" command could give disk stats with respective to blocks per second received and sent. Also, would show number of processes running or blocked.
-- The "iostat" command (reads data from /proc/diskstats & belongs to sysstat package), otherwise "iostat -xd" (extended for more data and only disk stats) could be a good tool to analyze disk layer subsystem. Look for "await" (average wait time) and "svctm"(service time), "avgrq-sz" (average size of request), "avgqu-sz" (average queue length), rrqm/s & wrqm/s (read/write requests merged per second). The command "iostat -xd 1 10" would continuously print 10 samples of iostat output with delay of 1 second (please ignore the first sample since it is an average data from reboot).

-- IOPS or I/O Per Second, is measured as the sum of (r/s + w/s), otherwise, displayed as "tps" when iostat command used without "-x" argument.

rrqm/s = The number of read requests merged per second that were queued to the io scheduler for the device.
wrqm/s = The number of write requests merged per second that were queued to the io scheduler for the device.
r/s = The number of read requests that were completed by the device per second.
w/s = The number of read requests that were completed by the device per second.
rsec/s = The number of sectors read from the device per second, as measured by completed io.
wsec/s = The number of sectors written to the device per second, as measured by completed io.
avgrq-sz = The average size, in sectors, of the requests that were completed by the device. This field is always displayed in sectors; neither -k or -m will affect the displayed units used by this column. This value is computed from other fields as shown:
avgrq-sz = ( rsec/s + wsec/s ) / ( r/s + w/s )
avgqu-sz = The average queue length of the requests that were issued to the device.
await = The average time, in milliseconds, that it took to complete I/O requests. This includes the time spent by the requests within the io scheduler sort queue and time spent by storage servicing them. This value is measured on a per io basis from the point at which the io is submitted into the scheduler until I/O done time.
svctm = The effective average service time, in milliseconds, for completed I/O requests that were issued to the device.
-- Always look out for "await", "%util" for each block device and high numbers of these output would shows which device is IO bound and help us to further troubleshoot.
-- The "iotop" command (installed by iotop package, available in standard ISO image or repo channel) is a top like command which dynamically displays current I/O usage by processes or threads on the system. One could run "iotop -P" (to show only process) or "iotop -o" (only show processes or threads actually doing I/O) if required.
-- Also, the usual process list command "ps" could give details about processes which are stuck as "uninterruptible sleep" state (waiting on IO), otherwise, "D" (defunct state: stuck) would also provide a good information in troubleshooting.
-- Using below command one could view the disk IO stats on previous days:
# LANG=C /usr/bin/sar -dp -f /var/log/sa/sa<XX>
-- It is important to note that high I/O wait percentages could not be a concern especially on machines running I/O bound applications. Sometimes, yes this could be an indication of slowness by disk sub-systems in responding or could be due to an issue with kernel which needs further analysis and tuning. Need to check with hardware disk drive vendor to see if device is at optimal best or if something such as firmware update may be necessary.
-- At times it may be required to change the default elevator (disk elevator or IO scheduler) to something more meaningful or required depending on situations. "deadline" is now the default IO scheduler in RHEL 7.x (except SATA drives) which was earlier "CFQ" (Completely Fair Queuing).
-- If the hard drives being used consists of both spindle based drives and SSD then speed could be improved by making SSD as a cache device for larger hard drives. Refer this link for more details: https://www.redhat.com/en/blog/improving-read-performance-dm-cache
<<>> for Network <<>>
-^- There are a many common pre-checks to be done before diving into troubleshooting a glitch in network. Make sure that network drivers/firmware of system are updated. Network interface speed is matching with router/gateway speed, as we know that overall network speed would operate on slowest network component in an infrastructure.
-^- Common Linux native network commands such as "netstat", "ip", "ethtool", "ss" (socket statistics) etc., could be used to understand network statistics and infrastructure. The "netstat" can provide details about open network connections and stack statistics. This command would basically pull data from /proc/net/[dev|tcp|unix] and other files stored under "/proc/net/" directory.

-^- The "/proc/net/dev" file would provide overall network packets received/sent/dropped/collisions etc,. This file "/proc/net/tcp" is another useful source of information which provides details about TCP socket information.
-^- The "ethtool" command would be the ideal one when someone wish to see packet drops/loss at hardware level. Need to look out for "errors|drops|discards|fail|missed" etc, while analyzing the data (example: ethtool -S eth0|egrep -i "errors|drops|discards|fail|missed"). This command could also be used to identify network card driver/firmware version. Even "ip -s link" would be a good option to know about drops/errors/collisions etc.

-^- To test network bandwidth one may use qperf, iperf, netcat, dd etc., and other available open-source commands. The "qperf" is native available in the default RHEL server repo channel could be used when required ( available in standard RHEL ISO image for offline install).
Refer this link to know how to use qperf to test bandwidth:
> To check network throughput between server and client, run "qperf" command on server end and then run the command "qperf -t 60 --use_bits_per_sec <ServerIP> tcp_bw" as shown below and latency using "tcp_lat" parameter:

-^- The "dropwatch" command installed by dropwatch package is an interactive tool which can monitor packet drops by kernel.
-^- The "nethogs" application in the Extra Packages for Enterprise Linux (EPEL) repository lists the network interface usage by application for applications using the TCP connections.
-^- If there is a need to analyze issues at network packet level then one could use "tcpdump" command to capture dump data to analyze further. This should be installed and available by default on standard installations.
To capture network packets this format could be used :
" tcpdump -s 0 -i {INTERFACE} -w {FILEPATH} [filter expression] ".
So, to capture network packet traffic on interface "eth0", we could run "#tcpdump -s 0 -i eth0 -w /tmp/tcpdump.pcap" and hit "ctrl+c" to terminate the process. Later the same file could be read using the command "tcpdump -r /tmp/tcpdump.pcap".
> A sample tcpdump capture with a short span of time is show in below snap:-

-^- There are at times an in-correct DNS configuration may also lead to a glitch in network performance.
-^- We could check the network stats of any earlier days not more than 28 days (by default) of data using SAR command as shown below:-
# LANG=C /usr/bin/sar -n DEV -f /var/log/sa/sa<XX>
> To see the network packet flow for earlier days between specific time (provided sysstat is active):

* It may be required to perform advanced level of investigations further.
This a wonderful Red Hat article for network performance analysis and tuning :
All the best!
7 comments:
You need to be a part of a contest for one of the greatest websites on the internet.
I will highly recommend this web site!
It's going to be ending of mine day, except before ending I am reading
this fantastic paragraph to improve my experience.
Greetings from Colorado! I'm bored to tears at work so I decided
to browse your blog on my iphone during lunch break. I really
like the knowledge you present here and can't wait to take a look when I get home.
I'm shocked at how quick your blog loaded on my cell phone ..
I'm not even using WIFI, just 3G .. Anyhow, very good
blog!
Mind-blowing blog this one. By far the best one I have read in my 9+ years of career as Linux admin.
Kudos. Keep writing
Thank you Prabodh.
Great post
CPU bottlenecks can impact gaming performance, leading to lower frame rates and laggy gameplay.
Post a Comment